Outlier Detection & Handling
Outlier Detection & Handling
Introduction
Outliers are data points that significantly deviate from the majority of observations in a dataset. They can arise from measurement errors, data entry mistakes, or represent genuine extreme values. Proper outlier detection and handling is crucial for building robust machine learning models, as outliers can severely impact model performance and lead to incorrect conclusions.
What Are Outliers?
 Outliers can significantly affect statistical models like linear regression
Outliers are observations that lie an abnormal distance from other values in a dataset. They can be:
Univariate Outliers: Extreme values in a single variable
- Example: A person's age recorded as 200 years
Multivariate Outliers: Normal in individual variables but unusual in combination
- Example: A 5-year-old with a PhD degree
Types of Outliers:
- Point Outliers: Individual data points that are anomalous
- Contextual Outliers: Anomalous in a specific context
- Collective Outliers: Groups of data points that are anomalous together
Why Outliers Matter
Negative Impact
- Statistical Measures: Skew mean, variance, and correlation
- Model Performance: Can lead to poor generalization
- Assumptions: Violate normality and homoscedasticity assumptions
- Visualization: Make it difficult to see patterns in the majority of data
Positive Aspects
- Fraud Detection: Outliers might be the signal you're looking for
- Medical Diagnosis: Unusual symptoms might indicate rare diseases
- Quality Control: Identify defective products or processes
- Scientific Discovery: Unexpected results can lead to new insights
Outlier Detection Methods
Statistical Methods
Z-Score Method
 Z-score measures how many standard deviations away from the mean
The Z-score measures how many standard deviations a data point is from the mean.
Formula: Z = (x - μ) / σ
Threshold: Typically |Z| > 2 or |Z| > 3
When to use:
- Data is approximately normally distributed
- Univariate outlier detection
- Quick screening for obvious outliers
Pros:
- Simple and fast
- Easy to interpret
- Works well for normal distributions
Cons:
- Assumes normal distribution
- Sensitive to extreme outliers (they affect mean and std)
- Not suitable for skewed distributions
Interquartile Range (IQR) Method
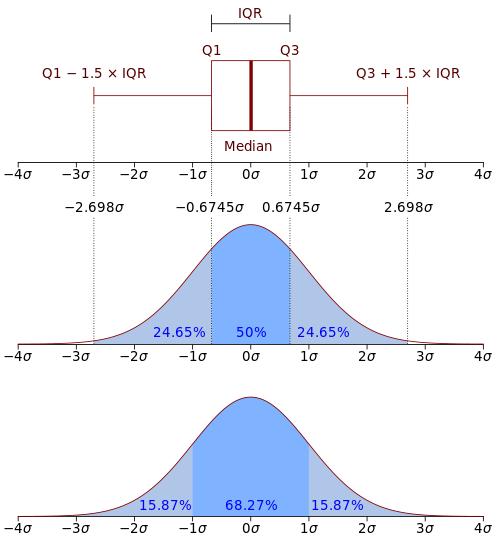 IQR method uses quartiles to identify outliers
Uses quartiles to identify outliers based on the spread of the middle 50% of data.
Formula:
- IQR = Q3 - Q1
- Lower bound = Q1 - 1.5 × IQR
- Upper bound = Q3 + 1.5 × IQR
When to use:
- Non-normal distributions
- Robust to extreme values
- Univariate outlier detection
Pros:
- Robust to outliers
- No distributional assumptions
- Easy to visualize with box plots
Cons:
- Fixed threshold (1.5 × IQR)
- May not work well for all distributions
- Univariate only
Distance-Based Methods
Local Outlier Factor (LOF)
 LOF compares local density of a point with its neighbors
LOF measures the local deviation of a data point with respect to its neighbors.
How it works:
- Find k-nearest neighbors for each point
- Calculate local reachability density
- Compare point's density with neighbors' densities
- Points with significantly lower density are outliers
When to use:
- Multivariate outlier detection
- Data with varying densities
- When local context matters
Pros:
- Handles varying densities
- Considers local neighborhood
- Good for multivariate data
Cons:
- Computationally expensive
- Sensitive to k parameter
- Difficult to interpret scores
Model-Based Methods
Isolation Forest
 Isolation Forest isolates outliers with fewer splits
Isolation Forest isolates outliers by randomly selecting features and split values.
Key Insight: Outliers are easier to isolate (require fewer splits) than normal points.
How it works:
- Randomly select a feature and split value
- Recursively partition data
- Outliers will be isolated with shorter paths
- Average path length across multiple trees
When to use:
- Large datasets
- High-dimensional data
- No assumptions about data distribution
Pros:
- Scalable to large datasets
- Works in high dimensions
- No need for labeled data
- Linear time complexity
Cons:
- Less interpretable
- May not work well with normal data having many irrelevant features
- Parameter tuning required
Clustering-Based Methods
DBSCAN for Outlier Detection
 DBSCAN identifies noise points as outliers
DBSCAN clusters data and treats noise points as outliers.
Parameters:
- eps: Maximum distance between points in the same cluster
- minPts: Minimum number of points to form a cluster
Outliers: Points that don't belong to any cluster (noise points)
When to use:
- Data with natural clusters
- Varying cluster densities
- When outliers are isolated points
Pros:
- No assumption about number of clusters
- Handles varying densities
- Robust to outliers
Cons:
- Sensitive to parameters
- May struggle with high-dimensional data
- Requires domain knowledge for parameter setting
Outlier Handling Strategies
1. Keep Outliers
When: Outliers are meaningful and represent valid extreme cases
Examples:
- Fraud detection (outliers are the target)
- Medical diagnosis (rare symptoms)
- Financial analysis (market crashes)
2. Remove Outliers
When: Outliers are clearly errors or not relevant to the analysis
Considerations:
- Loss of information
- Reduced sample size
- May introduce bias
Best Practices:
- Document removal criteria
- Keep track of removed data
- Consider impact on conclusions
3. Cap/Winsorize Outliers
Method: Replace outliers with less extreme values
Approaches:
- Cap at percentiles (e.g., 1st and 99th percentiles)
- Cap at mean ± k standard deviations
- Use IQR bounds
When to use:
- Want to retain all observations
- Outliers are measurement errors
- Need to preserve sample size
4. Transform Data
Methods:
- Log transformation:
log(x + 1) - Square root transformation:
√x - Box-Cox transformation
- Robust scaling
When to use:
- Skewed distributions
- Want to reduce impact without removal
- Preserve relationships
5. Use Robust Methods
Approach: Use algorithms that are inherently robust to outliers
Examples:
- Robust regression (Huber, RANSAC)
- Tree-based methods
- Median-based statistics
Choosing the Right Approach
 Decision framework for outlier detection
Decision Framework:
- Understand your domain:
- Are outliers meaningful?
- What could cause extreme values?
- What's the cost of false positives/negatives?
- Examine data distribution:
- Normal → Z-score
- Skewed → IQR
- Unknown → Multiple methods
- Consider dimensionality:
- Univariate → Z-score, IQR
- Multivariate → LOF, Isolation Forest
- Evaluate computational constraints:
- Small data → Any method
- Large data → Isolation Forest
- Real-time → Simple statistical methods
- Validate results:
- Visual inspection
- Domain expert review
- Impact on downstream tasks
Best Practices
Detection
- Use multiple methods: Different methods may find different types of outliers
- Visualize results: Always plot your data and outliers
- Consider context: Domain knowledge is crucial
- Validate findings: Check if detected outliers make sense
Handling
- Document decisions: Keep track of what you did and why
- Preserve original data: Always keep a copy of the original dataset
- Assess impact: Measure how handling affects your results
- Be transparent: Report outlier handling in your methodology
Validation
- Cross-validation: Ensure outlier detection doesn't overfit
- Sensitivity analysis: Test different thresholds and methods
- Expert review: Have domain experts validate findings
- Monitor performance: Track how outlier handling affects model performance
Common Pitfalls
- Automatic removal: Don't blindly remove all detected outliers
- Single method reliance: Different methods detect different types of outliers
- Ignoring domain knowledge: Statistical outliers may not be domain outliers
- Data leakage: Don't use test data to determine outlier thresholds
- Over-cleaning: Removing too many points can bias results
Real-World Applications
Healthcare
- Identify unusual patient symptoms
- Detect medical device malfunctions
- Find rare disease cases
Finance
- Fraud detection
- Risk management
- Algorithmic trading anomalies
Manufacturing
- Quality control
- Equipment failure prediction
- Process optimization
Marketing
- Customer behavior analysis
- A/B test result validation
- Campaign performance monitoring
Key Takeaways
- Outliers aren't always bad: They might be the signal you're looking for
- Context matters: Statistical outliers may not be domain outliers
- Use multiple methods: Different techniques detect different types of outliers
- Visualize your data: Always plot outliers to understand them
- Document your process: Keep track of detection and handling decisions
- Validate results: Check impact on downstream tasks
- Consider robust methods: Sometimes it's better to use outlier-resistant algorithms
Interactive Exploration
Use the controls to:
- Switch between different outlier detection methods
- Adjust detection thresholds and parameters
- Try different outlier handling strategies
- Observe how outliers affect data distribution
- Compare the effectiveness of different methods on various data patterns